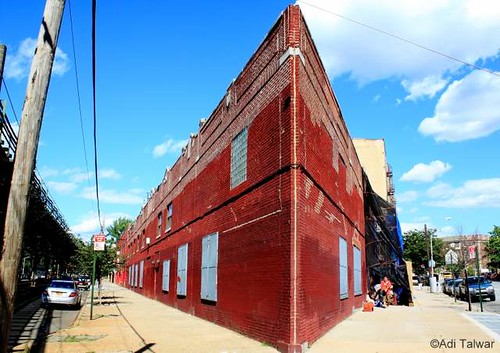
New data sources highlighting housing and population trends in our borough and city are now on-line, including a great new database and interface from the Furman Center. The NYU housing research center recently debuted their brand new Subsidized Housing Information Project, also known as SHIP, that has a wealth of information about more than 2,500 properties in the city that have some form of subsidy that keeps rents affordable for tenants. The New York Times Real Estate Section recently profiled the new database.
Properties generally fall into at least one of four categories, including HUD Insured (e.g., a Section 202 Senior Housing project), project-based Section 8 (as opposed to the voucher program), low income housing tax credits (responsible for much of the affordable housing created in NYC the past two decades) and a state moderate and middle income program known as Mitchell Lama that includes buildings such as Tracey Towers and Keith Plaza.
About 675 subsidized properties fall in the Bronx, though more than 80 of these have already opted out of their affordability requirements and now offer market rents. (You can find out this type of information pretty easily on their website.)
One of the main purposes of the SHIP database is to help advocates identify properties where affordabilty requirements will expire in the coming years and develop strategies to preserve these homes as affordable for current and future tenants. Citywide, 329 properties with 66,000 units have already opted out of their affordability programs. While new affordable units are created every year and counted as part of the mayor's 10-year 165,000 unit plan, it is much more cost effective and efficient to preserve an apartment as affordable than to build a new one.
Rent stabilized properties are not included in the SHIP database as they are not subsidized, merely regulated. (Indeed, any apartment where a family pays half of their income on rent cannot be considered affordable, as is the case for nearly 40 percent of Bronx renter households.
You can get this data on the same Furman Center site under the "Neighborhood Info" tab.) Yet the loss of cheaper rent stabilized apartments greatly exceeds the loss of subsidized units, and the Bronx is ground zero for families struggling to make rent each month in a nation where real wages for the bottom 50 percent declined by 12.6 percent between 1980 and 2007, and have managed just an 0.7 percent annual growth for those in the 50-95th percentiles (see page 18 of this research paper by the Fiscal Policy Institute).
Meanwhile, the Congressional Budget Office just released a report on the growing income gap that is fueling the sentiment behind Occupy Wall Street and related movements. The Census Bureau has also been releasing a steady stream of data on this hot topic and the Pew Center has done a great job analyzing and condensing this data while posting a series of articles including this one on the growing poverty rate numbers. A similar report delves into the topic of multi-generational households, and how more and more relatives are doubling up to reduce housing costs. They break this data down by household type, age, gender, ethnicity and place of birth, and populations that predominate in the Bronx are those whose rates of doubling up are the highest nationally.
Finally, for more Bronx-specific Census 2010 data, don’t miss Lehman College’s Bronx Data Center page. Professor William Bosworth has begun to map the new data on race and ethnicity at the micro level in the Bronx (census blocks) and at the neighborhood level for the City.


