Next month the U.S. Census Bureau will release detailed data from the 2010 decennial census. We will be able to access data down to the tract level via the American Fact Finder tool (just updated to be more user friendly) on the Census website, but only the information gathered from what used to be called the short form. No longer in use are the “long forms” that a sampling of the population got in 2000 or 1990 and were used to give estimates on in depth questions such as time traveled to work, country of birth, and sources of income.
The Census Bureau has switched to a new system to gather this type of data called the American Community Survey (ACS) which began in 2005. The ACS is an annual sampling of the population to gather the same type of data that used to be collected on the so-called long forms every 10 years. One main difference, however, is that the sample size in any given year of the ACS is too small to be reliable below the county level.
What the Census Bureau has done is to combine ACS data into three- and five-year pools to make better estimates. Three-year estimates (e.g., 2006-2009 data) have been available for a couple of years, but only down to the PUMA level (Public Use Microdata Areas, in New York City also called Sub-Borough Areas which closely align to Community Districts with some exceptions).
Five-year estimates were just released on the AFF site last month and allow users to get detailed data at the tract level. While this represents the average characteristics over the 5-year period of time of data collection, the larger sample size means the data is more accurate. It also allows an ongoing look at neighborhood demographic change instead of waiting 10 years for new data.
Here is the difference between the data sets according to the Census Bureau.
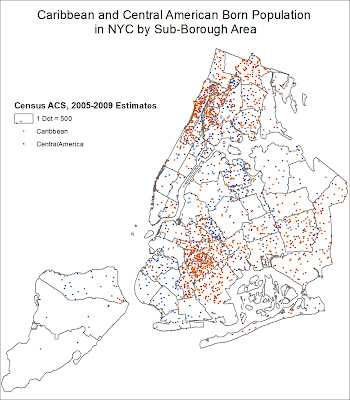
I downloaded the new five-year (2005-2009) data for New York City last week and made a couple of maps. For now I just plotted the PUMA level (Community Board approximations) data and will work on some tract level maps in the near future. Consider it a preview of the barrage of Census data we should be getting over the next few months. I tried to pick some data-sets that we are not as used to seeing. Click on any of the map images to view larger versions.
Percent of Population that did not move in the previous 12 months:
 |
| While homeowners are less likely to move than renters, the foreclosure crisis has likely had a strong effect on this data, causing many homeowner families to move who would not have otherwise. |
Percent of Households that speak English and another language at home:
More maps after the jump...
Percent of the Population that is foreign born:
Here are a number of maps showing the distributions of various foreign-born populations:


How do you make these maps? please share..
ReplyDelete